



Ballard Reports Q3 2023 Results
 Tweet
Tweet Share
Share E-mail
Get Alerts BLDP Hot Sheet
Join SI Premium – FREE
"We delivered robust revenue growth in Q3, with shipments to our core mobility markets substantially improved both year-over-year and quarter-over-quarter," said
"Concurrent with our strong revenue growth in Q3, we also delivered a substantial improvement in our gross margin performance. We are pleased with the momentum heading into the fourth quarter as we continue to focus on Q4 deliveries, customer platform wins, order intake for 2024 revenue, and product cost reduction initiatives," said
"Amidst an uncertain economic environment, we continue to exercise cost discipline, with Q3 cash operating costs roughly flat and cash burn significantly reduced compared to the prior year. We continue to track to our full-year guidance ranges for operating and capital expenditures, and we ended the quarter with cash and cash equivalents of
"We are encouraged by constructive hydrogen policy developments in the US and
Q3 2023 Financial Highlights
(all comparisons are to Q3 2022 unless otherwise noted)
- Total revenue was
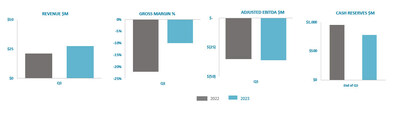
$27.6 million in the quarter, up 29% year-over-year.- Heavy Duty Mobility revenue of
$21.1 million increased 67%, driven primarily by higher revenues from the rail and marine verticals, partially offset by lower revenues in bus and truck. - Stationary revenue of
$2.9 million decreased 5% primarily due to lower sales inNorth America , partially offset by higher revenues inEurope . - Emerging and Other Markets revenue of
$3.6 million decreased 37% compared to the prior year, driven primarily by lower shipments toEurope .
- Heavy Duty Mobility revenue of
- Gross margin was (10)% in the quarter, an increase of 12-points, driven by higher revenues, product cost reduction initiatives, and a reduction in inventory provisions.
- Total Operating Expenses and Cash Operating Costs3 were
$36.3 million and$30 .3 million, respectively, a decrease of 9% and an increase of 1%, respectively, from Q3 2022. The decrease in Total Operating Expenses was driven primarily by lower general and administrative expenses, largely offset by an increase in sales and marketing expenses. - Total Cash Used by Operating Activities was
$22.0 million , compared to$30.3 million in the prior year, while Total Cash Used by Investing Activities was$11.1 million , compared to$15.5 million in Q3 2022. Cash and cash equivalents was$781.0 million at the end of Q3 2023 compared to$955.4 million in the prior year. - Adjusted EBITDA3 was
($36.2) million , compared to($35.1) million , primarily as a result of a higher loss attributable to the Weichai Ballard JV, the increase in Cash Operating Costs and partially offset by the improvement in gross margin loss. - As a result of further proposed restructuring of operations at Ballard Motive Solutions, non-cash impairment charges for goodwill and intangible assets of
$26.3 million were recognized in the quarter. - Ballard received approximately
$14.8 million of new orders in Q3, and delivered orders valued at$27.6 million , resulting in an Order Backlog of approximately$134.6 million at the end of Q3. Orders from customers inEurope andNorth America and for Power Products now represent close to 80% of the total Order Backlog. - The 12-month Order Book was
$72.7 million at end-Q3, a decrease of$13.1 million , or approximately 15%, due to slower order bookings and an increase in product shipments during the quarter.
Order Backlog ($M) | Order Backlog | Orders Received | Orders Delivered | Order Backlog |
Total Fuel Cell |
2023 Outlook
In 2023, Ballard maintains its guidance ranges for Total Operating Expense3 and Capital Expenditure4 as noted below. Capital Expenditures for 2023 are expected to be in the low end of the guidance range for the full year period.
2023 | Guidance |
Total Operating Expense3 | |
Capital Expenditure4 |
Q3 2023 Financial Summary
(Millions of | Three months ended | ||
2023 | 2022 | % Change | |
REVENUE | |||
Fuel Cell Products & Services:1 | |||
Heavy-Duty Mobility | 67 % | ||
Bus | (6 %) | ||
Truck | (25 %) | ||
Rail | 2,133 % | ||
Marine | 156 % | ||
Stationary | (5 %) | ||
Emerging and Other Markets | (37 %) | ||
Total Fuel Cell Products & Services Revenue | 29 % | ||
PROFITABILITY | |||
Gross Margin $ | ( | 41 % | |
Gross Margin % | (10 %) | (22 %) | 12pts |
Total Operating Expenses | (9 %) | ||
Cash Operating Costs2 | 1 % | ||
Equity loss in JV & Associates | ( | ( | 300 % |
Adjusted EBITDA3 | ( | ( | (3 %) |
Net Loss | ( | ( | (46 %) |
Loss Per Share | ( | ( | (49 %) |
CASH | |||
Cash provided by (used in) Operating Activities: | |||
Cash Operating Loss | ( | ( | 36 % |
Working Capital Changes | (85 %) | ||
Cash used by Operating Activities | ( | ( | 27 % |
Cash and cash equivalents | (18 %) | ||
For a more detailed discussion of Ballard Power Systems' third quarter 2023 results, please see the company's financial statements and management's discussion & analysis, which are available at www.ballard.com/investors, www.sedar.com and www.sec.gov/edgar.shtml.
Conference Call
Ballard will hold a conference call on
About Ballard Power Systems
Ballard Power Systems' (NASDAQ: BLDP; TSX: BLDP) vision is to deliver fuel cell power for a sustainable planet. Ballard zero-emission PEM fuel cells are enabling electrification of mobility, including buses, commercial trucks, trains, marine vessels, and stationary power. To learn more about Ballard, please visit www.ballard.com.
Important Cautions Regarding Forward-Looking Statements
Some of the statements contained in this release are forward-looking statements within the meaning of the
Endnotes |
1 We report our results in the single operating segment of Fuel Cell Products and Services. Our Fuel Cell Products and Services segment consists of the sale of PEM fuel cell products and services for a variety of applications including Heavy-Duty Mobility (consisting of bus, truck, rail, and marine applications), Stationary Power, and Emerging and Other Markets (consisting of material handling, off-road, and other applications). Revenues from the delivery of Services, including technology solutions, after sales services and training, are included in each of the respective markets.
|
2 Note that Cash Operating Costs, EBITDA, and Adjusted EBITDA are non-GAAP measures. Non-GAAP measures do not have any standardized meaning prescribed by GAAP and therefore are unlikely to be comparable to similar measures presented by other companies. Ballard believes that Cash Operating Costs, EBITDA, and Adjusted EBITDA assist investors in assessing Ballard's operating performance. These measures should be used in addition to, and not as a substitute for, net income (loss), cash flows and other measures of financial performance and liquidity reported in accordance with GAAP. For a reconciliation of Cash Operating Costs, EBITDA, and Adjusted EBITDA to the Consolidated Financial Statements, please refer to the tables below. |
Cash Operating Costs measures total operating expenses excluding stock-based compensation expense, depreciation and amortization, impairment losses or recoveries on trade receivables, restructuring charges, acquisition related costs, the impact of unrealized gains or losses on foreign exchange contracts, and financing charges. EBITDA measures net loss excluding finance expense, income taxes, depreciation of property, plant and equipment, and amortization of intangible assets. Adjusted EBITDA adjusts EBITDA for stock-based compensation expense, transactional gains and losses, acquisition related costs, finance and other income, recovery on settlement of contingent consideration, asset impairment charges, and the impact of unrealized gains or losses on foreign exchange contracts.
3 Total Operating Expenses refer to the measure reported in accordance with IFRS.
|
4 Capital Expenditure is defined as Additions to property, plant and equipment and Investment in other intangible assets as disclosed in the Consolidated Statements of Cash Flows |
(Expressed in thousands of | Three months ended | ||
Cash Operating Costs | 2023 | 2022 | $ Change |
Total Operating Expenses | $ 36,280 | $ 39,995 | $ (3,715) |
Stock-based compensation expense | (3,106) | (2,828) | (278) |
Impairment recovery (losses) on trade receivables | (45) | - | (45) |
Acquisition related costs | (33) | (2,261) | 2,228 |
Restructuring and related (costs) recovery | (138) | (258) | 120 |
Impact of unrealized gains (losses) on foreign exchange contracts | (655) | (1,588) | 933 |
Depreciation and amortization | (2,048) | (3,065) | 1,017 |
Cash Operating Costs | $ 30,255 | $ 29,995 | $ 260 |
(Expressed in thousands of | Three months ended | |||
EBITDA and Adjusted EBITDA | 2023 | 2022 | $ Change | |
Net loss | $ (62,454) | $ (42,881) | $ (19,573) | |
Depreciation and amortization | 3,115 | 3,979 | (864) | |
Finance expense | 291 | 324 | (33) | |
Income taxes (recovery) | 20 | (420) | 440 | |
EBITDA | $ (59,028) | $ (38,998) | $ (20,030) | |
Stock-based compensation expense | 3,106 | 2,828 | 278 | |
Acquisition related costs | 33 | 2,261 | (2,228) | |
Finance and other (income) loss | (7,239) | (2,781) | (4,458) | |
Impairment charge on intangible assets | 2,266 | - | 2,266 | |
Impairment charge on goodwill | 23,991 | - | 23,991 | |
Impact of unrealized (gains) losses on foreign exchange contracts | 655 | 1,588 | (933) | |
Adjusted EBITDA | $ (36,216) | $ (35,102) | $ (1,114) | |

 View original content to download multimedia:https://www.prnewswire.com/news-releases/ballard-reports-q3-2023-results-301979880.html
SOURCE Ballard Power Systems Inc.
Serious News for Serious Traders! Try StreetInsider.com Premium Free!
You May Also Be Interested In
- Pelican Acquisition II prices $75M IPO on Nasdaq
- Zoomcar extends warrant exchange offer deadline to August 14
- Eos Energy rights offering raises $37.7M, falls short of full subscription
Create E-mail Alert Related Categories
PRNewswire, Press ReleasesRelated Entities
Earnings, Definitive AgreementSign up for StreetInsider Free!
Receive full access to all new and archived articles, unlimited portfolio tracking, e-mail alerts, custom newswires and RSS feeds - and more!
