



LFL Releases Second Quarter Financial Results
 Tweet
Tweet Share
Share E-mail
Toronto, Ontario--(Newsfile Corp. - August 6, 2026) - Leon's Furniture Limited(TSX: LNF)("LFL" or the "Company"), today announced financial results for the quarter ended June 30, 2026.
Financial Highlights Q2-2026
These comparisons are with Q2-2025 unless stated otherwise.
- System-wide sales for the quarter were $756.2 million, a decrease of 2.0%.
- Q2 Revenue was recorded at $631.2 million, a decrease of 2.0%, largely driven by a lower average unit price as overall retail delivered units were up on the quarter.
- Opened 4 new franchise locations in the quarter.
- Gross profit margin was 44.63%, a 19-basis points decline primarily due to unfavourable impact of foreign currency revaluations, partially offset by improved margin rate in the mattress category.
- Net Income was $35.0 million compared to $31.8 million in the prior year.
- Adjusted net income was $34.8 million compared to $39.4 million in the prior year.
- On June 30, 2026, unrestricted liquidity was $560.1 million compared to $454.5 million in the prior year, comprised of cash, cash equivalents, debt and equity instruments and the undrawn revolving credit facility.
Second Quarter - 4 Year Financial Performance of LFL
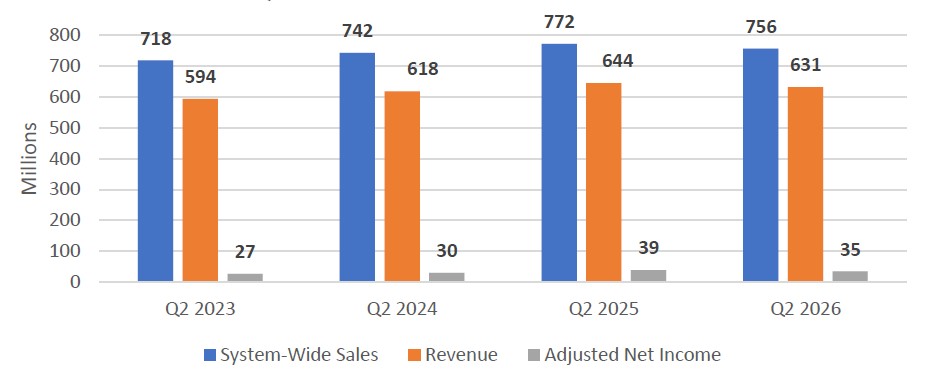
To view an enhanced version of this graphic, please visit:
https://images.newsfilecorp.com/files/4576/308482_1__second_quarter_-_4_year_financial_performance_of_lfl.jpg
(1) For a full explanation of the Company's use of non-IFRS and supplementary financial measures, please refer to the sections of this press release with the headings "Non-IFRS Financial Measures" and "Supplementary Financial Measures".
Mike Walsh, President and CEO of LFL, commented, "During the second quarter, our team executed with discipline in an environment that unfolded largely as we anticipated, with consumers remaining selective on larger discretionary purchases. Against that backdrop, the mattress category was once again a standout, as our focused-assortment playbook continued to deliver. Gross margin came in at 44.6%, higher than the prior year when excluding a prior year accounting-related foreign exchange gain. This performance reflects our consistent focus on thoughtful merchandising and an optimized promotional strategy. Combined with ongoing cost management across the business, these efforts contributed to adjusted diluted earnings per share of $0.51"
Mr. Walsh continued, "Looking ahead, although we have seen encouraging signs, the operating environment remains challenging and we are planning the balance of the year prudently. Comparisons ease through the back half, and our focus remains on gaining share through this cycle and coming out of it in an even stronger leadership position as conditions normalize. We generated solid cash flow, repurchased approximately $3.0 million of shares and ended the quarter with $560.1 million of unrestricted liquidity. At the same time, we kept investing in growth, and the four new stores we opened during the quarter are off to a strong start. Our scale, national distribution network and rock-solid balance sheet position us to continue delivering value to Canadians, outperforming in our core categories, and delivering long-term returns for our shareholders."
Summary financial highlights for the three months ended June 30, 2026 and June 30, 2025
| For the | Three months ended | |||||||||||
| (C$ in millions except %, share and per share amounts) | June 30, 2026 | June 30, 2025 | $ Increase (Decrease) | % Increase (Decrease) | ||||||||
| Total system-wide sales (1) | 756.2 | 771.5 | (15.3 | ) | (2.0%) | |||||||
| Franchise sales (1) | 125.0 | 127.4 | (2.4 | ) | (1.9%) | |||||||
| Revenue | 631.2 | 644.1 | (12.9 | ) | (2.0%) | |||||||
| Cost of sales | 349.5 | 355.4 | (5.9 | ) | (1.7%) | |||||||
| Gross profit | 281.7 | 288.7 | (7.0 | ) | (2.4%) | |||||||
| Gross profit margin as a percentage of revenue | 44.63% | 44.82% | ||||||||||
| Selling, general and administrative expenses (2) | 232.6 | 234.3 | (1.7 | ) | (0.7%) | |||||||
| SG&A as a percentage of revenue | 36.85% | 36.38% | ||||||||||
| Other income (3) | - | (1.4 | ) | 1.4 | (100.0%) | |||||||
| Income before net finance costs and income tax expense | 49.1 | 55.8 | (6.7 | ) | (12.0%) | |||||||
| Net finance costs | (3.0 | ) | (3.2 | ) | 0.2 | (6.3%) | ||||||
| Income before income taxes | 46.1 | 52.6 | (6.5 | ) | (12.4%) | |||||||
| Income tax expense | 11.3 | 13.2 | (1.9 | ) | (14.4%) | |||||||
| Adjusted net income (1) | 34.8 | 39.4 | (4.6 | ) | (11.7%) | |||||||
| Adjusted net income as a percentage of revenue (1) | 5.51% | 6.12% | ||||||||||
| After-tax mark-to-market (gain) loss on financial derivative instruments (1) | (0.2 | ) | 7.6 | (7.8 | ) | (102.6%) | ||||||
| Net income | 35.0 | 31.8 | 3.2 | 10.1% | ||||||||
| Basic weighted average number of common shares | 68,822,406 | 68,252,117 | ||||||||||
| Basic earnings per share | $0.51 | $0.47 | $0.04 | 8.5% | ||||||||
| Adjusted basic earnings per share (1) | $0.51 | $0.58 | $(0.07 | ) | (12.1%) | |||||||
| Diluted weighted average number of common shares | 68,977,741 | 68,639,781 | ||||||||||
| Diluted earnings per share | $0.51 | $0.46 | $0.05 | 10.9% | ||||||||
| Adjusted diluted earnings per share (1) | $0.51 | $0.57 | $(0.06 | ) | (10.5%) | |||||||
| Common share dividends declared | $0.24 | $0.20 | $0.04 | 20.0% | ||||||||
Same Store Sales (1)
| For the | Three months ended | |||||||||||
| (C$ in millions, except %) | June 30, 2026 | June 30, 2025 | $ Decrease | % Decrease | ||||||||
| Same store sales (1) | 613.6 | 627.3 | (13.7 | ) | (2.2%) | |||||||
Historical Same Store Sales (1) as previously reported based on comparable quarters
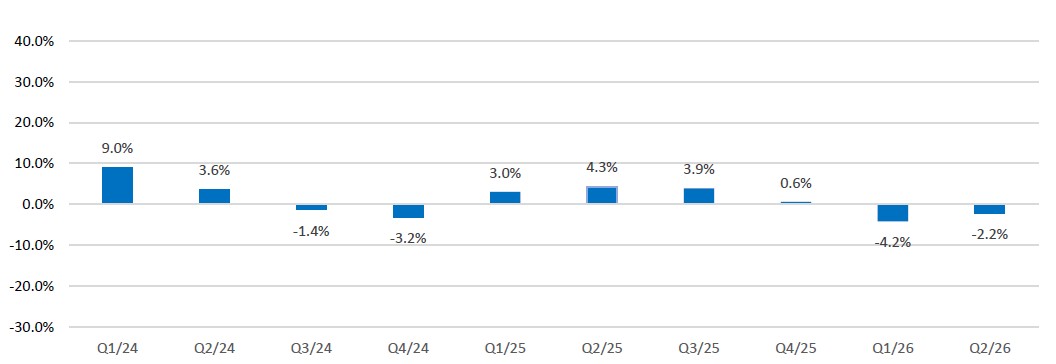
To view an enhanced version of this graphic, please visit:
https://images.newsfilecorp.com/files/4576/308482_2__historical_same_store_sales.jpg
(1) Please refer to the sections of this press release with the headings "Non-IFRS Financial Measures" and "Supplementary Financial Measures".
(2) Selling, general and administrative expenses ("SG&A")
(3) Gain on settlement please see note 20 of the 2025 fiscal year consolidated financial statements for further detail.
Revenue
For the three months ended June 30, 2026, revenue was $631.2 million compared to $644.1 million in the prior year, a decrease of $12.9 million or 2.0%. The decrease was largely driven by lower average unit price, as consumers continued to prioritize value; overall retail delivered units increased over the prior year. At the category level, furniture delivered sales decreased 4.2% against a strong prior-year comparable. Appliance sales decreased, driven by slowing builder pipelines in the commercial channel and an industry-wide retail environment that remained highly promotional. This was partially offset by strong growth in the mattress category, driven by an improved assortment.
Same Store Sales (1)
Same store sales in the quarter decreased by 2.2% compared to the prior year's quarter driven by factors discussed in the revenue section.
Gross Profit
The gross profit margin for the second quarter of 2026 was at 44.63% compared to 44.82%, a decrease of 19 basis points. Gross margin rate in the quarter was negatively impacted by 40 basis points from the impact of volatile foreign currency fluctuations in both the current and prior year and the resulting gain/loss on the revaluation of US dollar payables. The prior year benefited from a foreign exchange gain, while the current year recorded a foreign exchange loss from the strengthening of the US dollar and a higher ending payables balance. Normalizing for this, the improvement in gross margin rate was driven by improved margin rate in the mattress category and increased revenue from higher margin insurance and delivery service offerings.
Selling, General and Administrative Expenses ("SG&A")
The Company's SG&A as a percentage of revenue for the second quarter of 2026 was 36.85%, an increase of 47 basis points over the second quarter of 2025. The increase was driven by lower revenue and deleveraging of fixed costs, increased marketing due to the timing of promotions and the launch of new product partnerships, increased fuel costs and higher occupancy costs due to higher rents. This was partially offset by lower point-of-sale retail financing fees due to lower Bank of Canada interest rates.
Adjusted Net Income (1) and Adjusted Diluted Earnings Per Share (1)
Adjusted net income for the quarter was $34.8 million, which represents a decrease of $4.6 million over the prior year. The decline was ultimately driven by a decline in sales, the large year-over-year swing in the US dollar payables revaluation, and the recognition of the $1.4 million one-time benefit related to the CURO Holdings Corp. ("CURO") during the three months ending June 30, 2025.
The adjusted diluted earnings per share in the second quarter of 2026 was $0.51 per share, a decrease of 10.5% over the prior year's quarter.
Net Income and Diluted Earnings Per Share
Net income for the second quarter of 2026 was $35.0 million, or $0.51 per share on a diluted basis, compared to $0.46 per share in the prior year, an increase of $0.05 per share or 10.9% (net income of $31.8 million in the second quarter of 2025). The prior year included a large mark-to-market loss on the revaluation of derivatives.
Dividends
As previously announced, the Company paid a quarterly dividend of $0.24 per common share on 8th day of July 2026 to shareholders of record. Today the Directors have declared a quarterly dividend of $0.24 per common share payable on the 7th day of October 2026 to shareholders of record at the close of business on the 9th day of September 2026. As of 2007, dividends paid by Leon's Furniture Limited are "eligible dividends" pursuant to the changes to the Income Tax Act under Bill C-28, Canada.
(1) Please refer to the sections of this press release with the headings "Non-IFRS Financial Measures" and "Supplementary Financial Measures".
Outlook
Given the Company's strong and continuously improving financial position, its principal objective is to increase market share and profitability. LFL remains focused on effectively managing the Company's costs but to also continuously invest in the business to drive growth initiatives that will drive more customers to both our online eCommerce sites and our 301 store locations across Canada.
Non-IFRS Financial Measures
The Company uses financial measures that do not have standardized meaning under IFRS and may not be comparable to similar measures presented by other entities. The Company calculates the non-IFRS financial measures by adjusting certain IFRS measures for specific items the Company believes are significant, but not reflective of underlying operations in the period, as detailed below:
| Non-IFRS Measure | IFRS Measure |
| Adjusted net income | Net income |
| Adjusted income before income taxes | Income before income taxes |
| Adjusted earnings per share - basic | Earnings per share - basic |
| Adjusted earnings per share - diluted | Earnings per share - diluted |
| Adjusted EBITDA | Net income |
Adjusted Net Income
The Company calculates comparable measures by excluding the effect of changes in fair value of derivative instruments, related to the net effect of USD-denominated forward contracts. The Company uses derivative instruments to manage its financial risk in accordance with the Company's corporate treasury policy. Management believes excluding from income the effect of these mark-to-market valuations and changes thereto, until settlement, better aligns the intent and financial effect of these contracts with the underlying cash flows.
Adjusted EBITDA
Adjusted earnings before interest, income taxes, depreciation and amortization, mark-to-market adjustment due to the changes in the fair value of the Company's financial derivative instruments and any non-recurring charges to income ("Adjusted EBITDA") is a non-IFRS financial measure used by the Company. The Company considers adjusted EBITDA to be an effective measure of profitability on an operational basis and is commonly regarded as an indirect measure of operating cash flow, a significant indicator of success for many businesses. The Company's Adjusted EBITDA may not be comparable to the Adjusted EBITDA measure of other companies, but in management's view appropriately reflects the Company's specific financial condition. This measure is not intended to replace net income, which, as determined in accordance with IFRS, is an indicator of operating performance.
The following is a reconciliation of reported net income to adjusted EBITDA:
| For the | Three months ended | Six months ended | ||||||||||
| (C$ in millions) | June 30, 2026 | June 30, 2025 | June 30, 2026 | June 30, 2025 | ||||||||
| Net income | 35.0 | 31.8 | 56.5 | 55.7 | ||||||||
| Income tax expense | 11.5 | 10.8 | 18.3 | 18.3 | ||||||||
| Net finance costs | 3.0 | 3.2 | 6.1 | 5.8 | ||||||||
| Depreciation and amortization | 27.8 | 27.3 | 55.7 | 54.6 | ||||||||
| Gain on settlement | - | (1.4 | ) | - | (2.8 | ) | ||||||
| Mark-to-market (gain) loss on financial derivative instruments | (0.2 | ) | 10.1 | (2.1 | ) | 10.5 | ||||||
| Adjusted EBITDA | 77.1 | 81.8 | 134.5 | 142.1 | ||||||||
Total System Wide Sales
Total system wide sales refer to the aggregation of revenue recognized in the Company's consolidated financial statements plus the franchise sales occurring at franchise stores to their customers which are not included in the revenue figure presented in the Company's consolidated financial statements. Total system wide sales is not a measure recognized by IFRS and does not have a standardized meaning prescribed by IFRS, but it is a key indicator used by the Company to measure performance against prior period results. Therefore, total system wide sales as discussed in this MD&A may not be comparable to similar measures presented by other issuers. We believe that disclosing this measure is meaningful to investors because it serves as an indicator of the strength of the Company's overall store network, which ultimately impacts financial performance.
Franchise Sales
Franchise sales figures refer to sales occurring at franchise stores to their customers which are not included in the revenue figures presented in the Company's consolidated financial statements, or in the same store sales figures in this MD&A. Franchise sales is not a measure recognized by IFRS, and does not have a standardized meaning prescribed by IFRS, but it is a key indicator used by the Company to measure performance against prior period results. Therefore, franchise sales as discussed in this MD&A may not be comparable to similar measures presented by other issuers. Once again, we believe that disclosing this measure is meaningful to investors because it serves as an indicator of the strength of the Company's brands, which ultimately impacts financial performance.
Supplementary Financial Measures
The Company uses supplementary financial measures to disclose financial measures that are not (a) presented in the financial statements and (b) is, or is intended to be, disclosed periodically to depict the historical or expected future financial performance, financial position or cash flow, that is not a non-IFRS financial measure as detailed above.
Same Store Sales
Same store sales are defined as sales generated by stores, both in store and through online transactions, that have been open for more than 12 months on a fiscal basis. Same store sales as discussed in this MD&A may not be comparable to similar measures presented by other issuers, however this measure is commonly used in the retail industry. We believe that disclosing this measure is meaningful to investors because it enables them to better understand the level of growth of our business.
About Leon's Furniture Limited
Leon's Furniture Limited is the largest retailer of furniture, appliances and electronics in Canada. Our retail banners include: Leon's; The Brick; Brick Outlet; and The Brick Mattress Store. Finally, with The Brick's Midnorthern Appliance banner alongside with Leon's Appliance Canada banner, this makes the Company the country's largest commercial retailer of appliances to builders, developers, hotels and property management companies. The Company has 301 retail stores from coast to coast in Canada under various banners. The Company operates six websites: leons.ca, thebrick.com, furniture.ca, midnorthern.com, transglobalservice.com and appliancecanada.com.
Cautionary Statement
This press release may contain forward-looking statements that are subject to known and unknown risks and uncertainties that could cause actual results to vary materially from targeted results. Such risks and uncertainties include those described in Leon's Furniture Limited's periodic reports including the annual report or in the filings made by Leon's Furniture Limited from time to time with securities regulatory authorities.
This News Release may include certain "forward-looking statements" which are not comprised of historical facts. Forward-looking statements include estimates and statements that describe the Company's future plans, objectives or goals, including words to the effect that the Company or management expects a stated condition or result to occur. Forward-looking statements may be identified by such terms as "believes", "anticipates", "expects", "estimates", "may", "could", "would", "will", or "plan". Since forward-looking statements are based on assumptions and address future events and conditions, by their very nature they involve inherent risks and uncertainties. Although these statements are based on information currently available to the Company, the Company provides no assurance that actual results will meet management's expectations. Risks, uncertainties and other factors involved with forward-looking information could cause actual events, results, performance, prospects and opportunities to differ materially from those expressed or implied by such forward-looking information. Forward looking information in this news release includes, but is not limited to, the Company's objectives, goals or future plans, and estimates of market conditions. Factors that could cause actual results to differ materially from such forward-looking information include, but are not limited to failure to identify beneficial business opportunities, failure to convert the potential in the pursued business opportunities to tangible benefits to the Company or its shareholders, the ability of the Company to counteract the potential impact of pandemics on factors relevant to the Company's business, delays in obtaining or failures to obtain required shareholder and TSX approvals, changes in equity markets, inflation, changes in exchange rates, fluctuations in commodity prices, tariffs, safeguard measures, regulatory changes impacting demand for extended warranty contracts and other external economic changes, delays in the development of projects, and those risks set out in the Company's public documents filed on SEDAR+. Although the Company believes that the assumptions and factors used in preparing the forward-looking information in this news release are reasonable, undue reliance should not be placed on such information, which only applies as of the date of this news release, and no assurance can be given that such events will occur in the disclosed time frames or at all. The Company disclaims any intention or obligation to update or revise any forward-looking information, whether as a result of new information, future events or otherwise, other than as required by law.
For further information, please contact:
| Victor Diab Chief Financial Officer Leon's Furniture Limited Tel: (416) 243-4073 lflgroup.ca | Jonathan Ross LodeRock Advisors, Leon's Investor Relations [email protected] Tel: (416) 283-0178 |
To view the source version of this press release, please visit https://www.newsfilecorp.com/release/308482
Serious News for Serious Traders! Try StreetInsider.com Premium Free!
You May Also Be Interested In
- Geospace Technologies (GEOS) Misses Q3 EPS by 75c
- NextCure Inc. (NXTC) Misses Q2 EPS by 89c
- Tectonic Therapeutic (TECX) Tops Q2 EPS by 17c
Create E-mail Alert Related Categories
Newsfile, Press ReleasesRelated Entities
Dividend, Earnings, Maynard Um, Mark Zuckerberg, ARKSign up for StreetInsider Free!
Receive full access to all new and archived articles, unlimited portfolio tracking, e-mail alerts, custom newswires and RSS feeds - and more!
