




UPDATE: Natural Gas Inventory -243 bcf vs -236 bcf Expected

FREE Breaking News Alerts from StreetInsider.com!
StreetInsider.com Top Tickers, 10/9/2026
- Wall Street posts weekly gains with earnings, inflation data on tap
- Oil prices settle higher as more production shut ahead of hurricane
- Apple cuts iPhone 18 Pro orders due to soft demand, Nikkei Asia reports
- UBS flags level in gold prices where dip buyers will likely emerge
- Telecom stocks tumble on SpaceX spectrum acquisition news
 Tweet
Tweet Share
Share E-mail
Natural Gas Inventory -243 bcf vs -236 bcf Expected
Working gas in storage was 2,917 Bcf as of Friday, January 13, 2017, according to EIA estimates. This represents a net decline of 243 Bcf from the previous week. Stocks were 431 Bcf less than last year at this time and 77 Bcf below the five-year average of 2,994 Bcf. At 2,917 Bcf, total working gas is within the five-year historical range.
| Stocks billion cubic feet (Bcf) | Year ago (01/13/16) | 5-year average (2012-16) | |||||||||||||||||||||||
| Region | 01/13/17 | 01/06/17 | net change | implied flow | Bcf | % change | Bcf | % change | |||||||||||||||||
| East | 639 | 698 | -59 | -59 | 771 | -17.1 | 708 | -9.7 | |||||||||||||||||
| Midwest | 795 | 865 | -70 | -70 | 897 | -11.4 | 797 | -0.3 | |||||||||||||||||
| Mountain | 183 | 197 | -14 | -14 | 172 | 6.4 | 166 | 10.2 | |||||||||||||||||
| Pacific | 248 | 263 | -15 | -15 | 285 | -13.0 | 284 | -12.7 | |||||||||||||||||
| South Central | 1,052 | 1,137 | -85 | -85 | 1,223 | -14.0 | 1,040 | 1.2 | |||||||||||||||||
| Salt | 312 | 343 | -31 | -31 | 350 | -10.9 | 276 | 13.0 | |||||||||||||||||
| Nonsalt | 740 | 794 | -54 | -54 | 873 | -15.2 | 763 | -3.0 | |||||||||||||||||
| Total | 2,917 | 3,160 | -243 | -243 | 3,348 | -12.9 | 2,994 | -2.6 | |||||||||||||||||
At 10:30 a.m., Eastern Standard Time on January 26, 2017, EIA will begin including estimated measures of sampling variability for weekly estimates of working natural gas stocks and the net change in working natural gas stocks as part of the Weekly Natural Gas Storage Report (WNGSR). EIA has provided answers to frequently asked questions about the incorporation of estimated measures of sampling variability for published estimates of weekly stocks and their net changes in the WNGSR. Details about these changes can be found at: http://ir.eia.gov/ngs/notice.html.
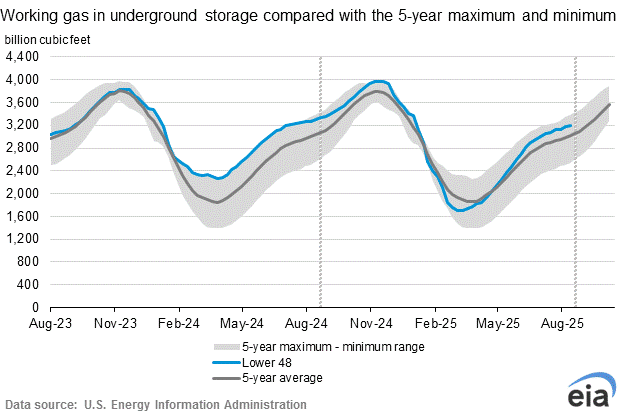
Note: The shaded area indicates the range between the historical minimum and maximum values for the weekly series from 2012 through 2016. The dashed vertical lines indicate current and year-ago weekly periods.
Serious News for Serious Traders! Try StreetInsider.com Premium Free!
You May Also Be Interested In
- Natural Gas Inventory 85 bcf vs 81 bcf Expected
- US imposes new sanctions on Iran targeting oil transport vessels
- Initial Jobless Claims 197K vs 200K Expected
Create E-mail Alert Related Categories
Commodities, ETFs, Economic DataSign up for StreetInsider Free!
Receive full access to all new and archived articles, unlimited portfolio tracking, e-mail alerts, custom newswires and RSS feeds - and more!
