




UPDATE: Natural Gas Inventory -68 bcf vs -61 bcf Expected

FREE Breaking News Alerts from StreetInsider.com!
StreetInsider.com Top Tickers, 10/9/2026
- Wall Street set for weekly gains with earnings, inflation data on tap
- Oil falls as Trump comments on Iran talks ease supply fears
- Apple cuts iPhone 18 Pro orders due to soft demand, Nikkei Asia reports
- UBS flags level in gold prices where dip buyers will likely emerge
- Telecom stocks tumble on SpaceX spectrum acquisition news
 Tweet
Tweet Share
Share E-mail
Natural Gas Inventory -68 bcf vs -61 bcf Expected
Working gas in storage was 2,295 Bcf as of Friday, March 3, 2017, according to EIA estimates. This represents a net decrease of 68 Bcf from the previous week. Stocks were 192 Bcf less than last year at this time and 363 Bcf above the five-year average of 1,932 Bcf. At 2,295 Bcf, total working gas is within the five-year historical range.
| Stocks billion cubic feet (Bcf) | Year ago (03/03/16) | 5-year average (2012-16) | |||||||||||||||||||||||
| Region | 03/03/17 | 02/24/17 | net change | implied flow | Bcf | % change | Bcf | % change | |||||||||||||||||
| East | 404 | 422 | -18 | -18 | 468 | -13.7 | 395 | 2.3 | |||||||||||||||||
| Midwest | 579 | 608 | -29 | -29 | 592 | -2.2 | 441 | 31.3 | |||||||||||||||||
| Mountain | 139 | 146 | -7 | -7 | 146 | -4.8 | 126 | 10.3 | |||||||||||||||||
| Pacific | 201 | 205 | -4 | -4 | 258 | -22.1 | 227 | -11.5 | |||||||||||||||||
| South Central | 972 | C | 982 | -10 | -6 | C | 1,023 | -5.0 | 742 | 31.0 | |||||||||||||||
| Salt | 326 | C | 333 | -7 | -3 | C | 290 | 12.4 | 177 | 84.2 | |||||||||||||||
| Nonsalt | 646 | 649 | -3 | -3 | 733 | -11.9 | 565 | 14.3 | |||||||||||||||||
| Total | 2,295 | C | 2,363 | -68 | -64 | C | 2,487 | -7.7 | 1,932 | 18.8 | |||||||||||||||
C=Reclassification. | |||||||||||||||||||||||||
Reclassifications from working gas to base gas resulted in decreased working gas stocks of approximately 4 Bcf in the South Central Salt region for the week ending March 3, 2017. The implied flow for the week is a decrease of 64 Bcf to working gas stocks. (See Notes and Definitions for more information on "implied flow.")
For information on sampling error in this report, see Estimated Measures of Sampling Variability table below.
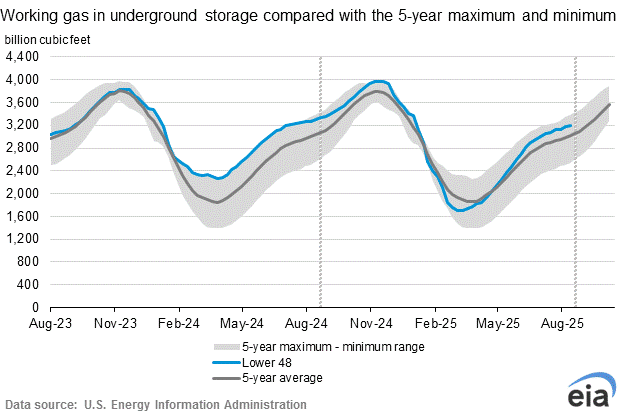
Note: The shaded area indicates the range between the historical minimum and maximum values for the weekly series from 2012 through 2016. The dashed vertical lines indicate current and year-ago weekly periods.
| Estimated measures of sampling variabilityDownload History (April 2015 to Present) | |||||||||||
|---|---|---|---|---|---|---|---|---|---|---|---|
| Coefficient of Variation for Stocks % of working gas | Standard Error for Net Change billion cubic feet (Bcf) | ||||||||||
| Region | 03/03/17 | 02/24/17 | net change | ||||||||
| East | 1.9 | 1.8 | 0.5 | ||||||||
| Midwest | 1.5 | 1.5 | 0.8 | ||||||||
| Mountain | 2.8 | 2.4 | 0.7 | ||||||||
| Pacific | 4.4 | 3.9 | 1.9 | ||||||||
| South Central | 2.0 | 1.9 | 1.2 | ||||||||
| Salt | 3.9 | 3.9 | 0.9 | ||||||||
| Nonsalt | 2.2 | 2.2 | 0.8 | ||||||||
| Total | 1.1 | 1.0 | 2.5 | ||||||||
Serious News for Serious Traders! Try StreetInsider.com Premium Free!
You May Also Be Interested In
- Natural Gas Inventory 85 bcf vs 81 bcf Expected
- US imposes new sanctions on Iran targeting oil transport vessels
- Jefferies highlights energy security risks after Strait of Hormuz crisis
Create E-mail Alert Related Categories
Commodities, ETFs, Economic DataSign up for StreetInsider Free!
Receive full access to all new and archived articles, unlimited portfolio tracking, e-mail alerts, custom newswires and RSS feeds - and more!
